https://ronsfinanciallab.com — turning academic research into plain investing sense
This is a credible academic source: the Journal of Quality Measurement and Analysis is published by Universiti Kebangsaan Malaysia, uses double-blind peer review, and is indexed in Scopus, WoS ESCI, MyCite, and ASEAN Citation Index.
Most retail investors picture the market as a list of individual stocks moving up and down, one by one. A recent Bursa Malaysia study suggests a more useful mental model: think of the market as a network of sectors, linked by return spillovers and risk transmission, where some sectors move closely together and others stay structurally independent. Two researchers mapped this sector network from 2019 to 2023 and found that its shape changes over time in ways that materially affect diversification, sector rotation, and how you spread your capital across the market
The market is a web, not a list
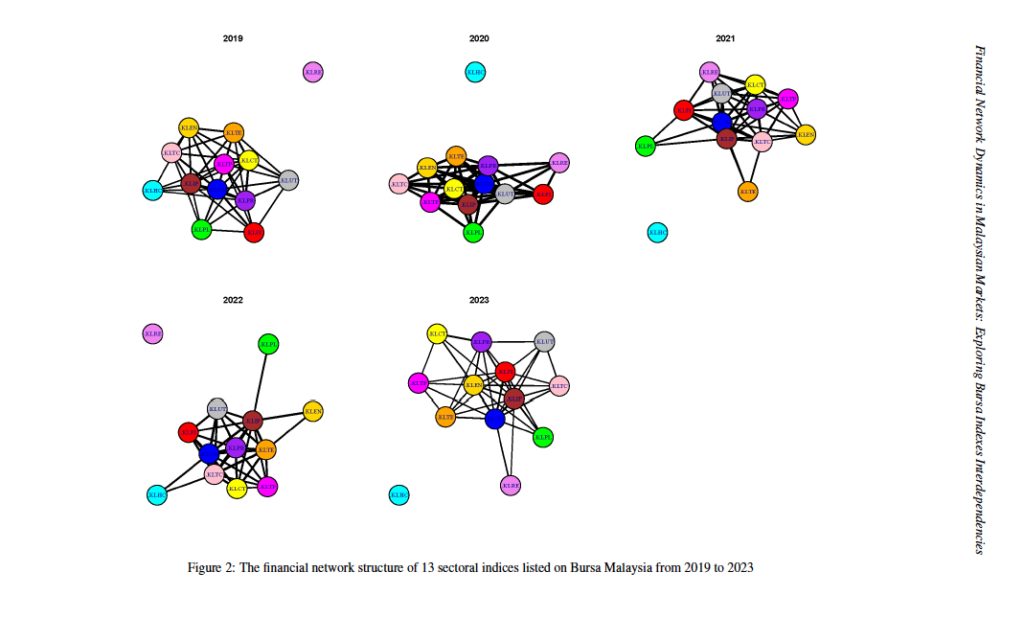
Picture each Bursa sector as a dot on a board: plantation, banking, technology, property, healthcare, and so on. Draw a line between two dots when those two sectors tend to move in the same direction. Thick lines mean strong co-movement. No line means they drift on their own.
When you map every sector this way, year by year, the web changes shape. In calm years, it spreads out evenly. In a crisis, it bunches up tight. That bunching is the part retail investors tend to miss.
****The colour may not match
The five-year story in three acts
2019 — a balanced board. Before the pandemic, sectors were moderately connected. No single sector dominated, and healthcare sat mostly on its own. A spread-out portfolio gave you real protection, since sectors were moving for their own reasons.
2020 — everything snapped together. The pandemic pulled the web into a tight knot. Co-movement spiked across the board. The study records the highest volatility of the whole period in 2020, driven by the global shock. For investors, this is the uncomfortable lesson: the year you most wanted diversification was the year your sectors stopped behaving differently. Holding ten stocks across eight sectors gave you far less protection in 2020 than the same portfolio gave you in 2019.
2021 to 2023 — the web loosened again. As recovery set in, sectors drifted apart and started trading on their own stories. By 2023, the market had returned to a sparse, independent structure, in which sector-specific factors mattered more than a shared mood.
The sectors that hold the market together
Two sectors stayed central throughout the entire period:
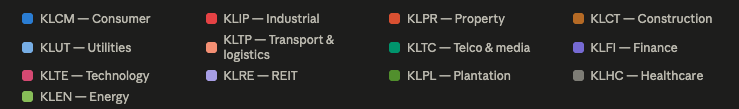
• Consumer Products & Services (.KLCM) — consistently one of the most connected sectors, with the highest number of links in several years.
• Industrial Products & Services (.KLIP) — equally well-connected, peaking in
• By 2023, Consumer Products & Services and Industrial Products & Services had become the most influential sectors in the market network.
• Think of them as the main roads of Bursa Malaysia. Many other sectors were connected to them, so changes in market mood were more likely to pass through these sectors.
• For a retail investor, this means consumer and industrial stocks can act as useful market signals. When these sectors start moving strongly, they may give an early clue about the direction of the broader market. Isolated sectors, such as healthcare or REITs, are less useful for reading the whole market because they often move independently.
The loners
Some sectors stayed on the edge of the web:
• Healthcare (.KLHC) dropped to zero connections in 2020 and 2021. Demand for medical services rose during the pandemic, yet the sector traded on its own track, disconnected from the wider market. That makes it a poor proxy for market direction but a useful diversifier, since it did not follow the crowd.
• REIT (.KLRE) showed weak and patchy links, isolated in several years.
An isolated sector cuts both ways. It gives you genuine diversification, since it ignores what the rest of the market is doing. It also gives you less benefit from a broad recovery, since the rising tide reaches it last.
The 2023 surprise: energy steps up
By the end of the period, Energy (.KLEN) climbed from a minor role to one of the most central and influential sectors, mirroring the global resurgence in energy stocks.
Technology (.KLTE) staged a smaller rebound. The point for a retail investor is that leadership rotates. The sector running the board in 2020 was not the one running it in 2023.
What this means for your portfolio
Diversification weakens exactly when you need it. Spreading across sectors protects you in normal years. In a shock, sectors lock together, and that protection thins out. Plan for this by holding genuinely different asset types, not different stocks within the same correlated cluster.
Watch the hubs for market direction. Consumer and industrial sectors carry the broad signal. Treat them as a thermometer for sentiment.
Use the loners on purpose. Healthcare and REITs march to their own beat. Hold a small slice for true diversification, with the understanding that they may lag a strong recovery.
Leadership rotates, so review your weightings. Energy went from minor to dominant in three years. A portfolio set and forgotten in 2020 would have missed that shift entirely.
Co-movement is a risk signal. When sectors that usually drift apart start moving as one, the market is tensing up. That clustering, more than any single price, warns you that risk is rising across the board.
Based on: Bahaludin, H. & Laham, M.F. (2025). Financial Network Dynamics in Malaysian Markets: Exploring Bursa Indices Interdependencies from 2019 to 2023. Journal of Quality Measurement and Analysis, 21(3), 319–335.
Ron’s Financial Lab shares educational content for retail investors and does not offer personalised investment advice. Do your own research before making any decision.